Caroline Livesey, Xhale Coaching Team

RPE: Rate of Perceived Exertion
In this article we will outline the science behind our ever popular function, RPE, and how you can use it to develop your athletes to their full potential. At Xhale we are always striving to integrate functions which enable you as coaches to have a closer relationship with your athletes and hence get the very best from them. We are not data driven, we are communication driven, and we believe this function is the perfect reflection of that. It gathers data, but that data comes only from how the athlete feels. How they feel can be consistently analysed no matter what the other data streams indicate.
What is RPE?
The Rate of Perceived Exertion (RPE) scale is a method used to express how hard an athlete feels they are working during exercise. Swedish researcher Gunnar Borg first developed this tool in the 1960s and through decades of further study and refinement it has shown to correlate strongly with actual physiological stress during training.
Outside of research, it offers a simple but accurate way to measure training stress for use in coaching. It measures what the athlete experiences in a session, which is not always in line with what was prescribed by the coach.
There are many things that the usual data we get from a session does not tell us. For example, athletes will be impacted by other life circumstances (such as work deadlines, diet choices or an unexpected response to previous training) which create different physical and mental stresses. As a result they may feel that a certain physical training load is much harder than it would be if they were rested.
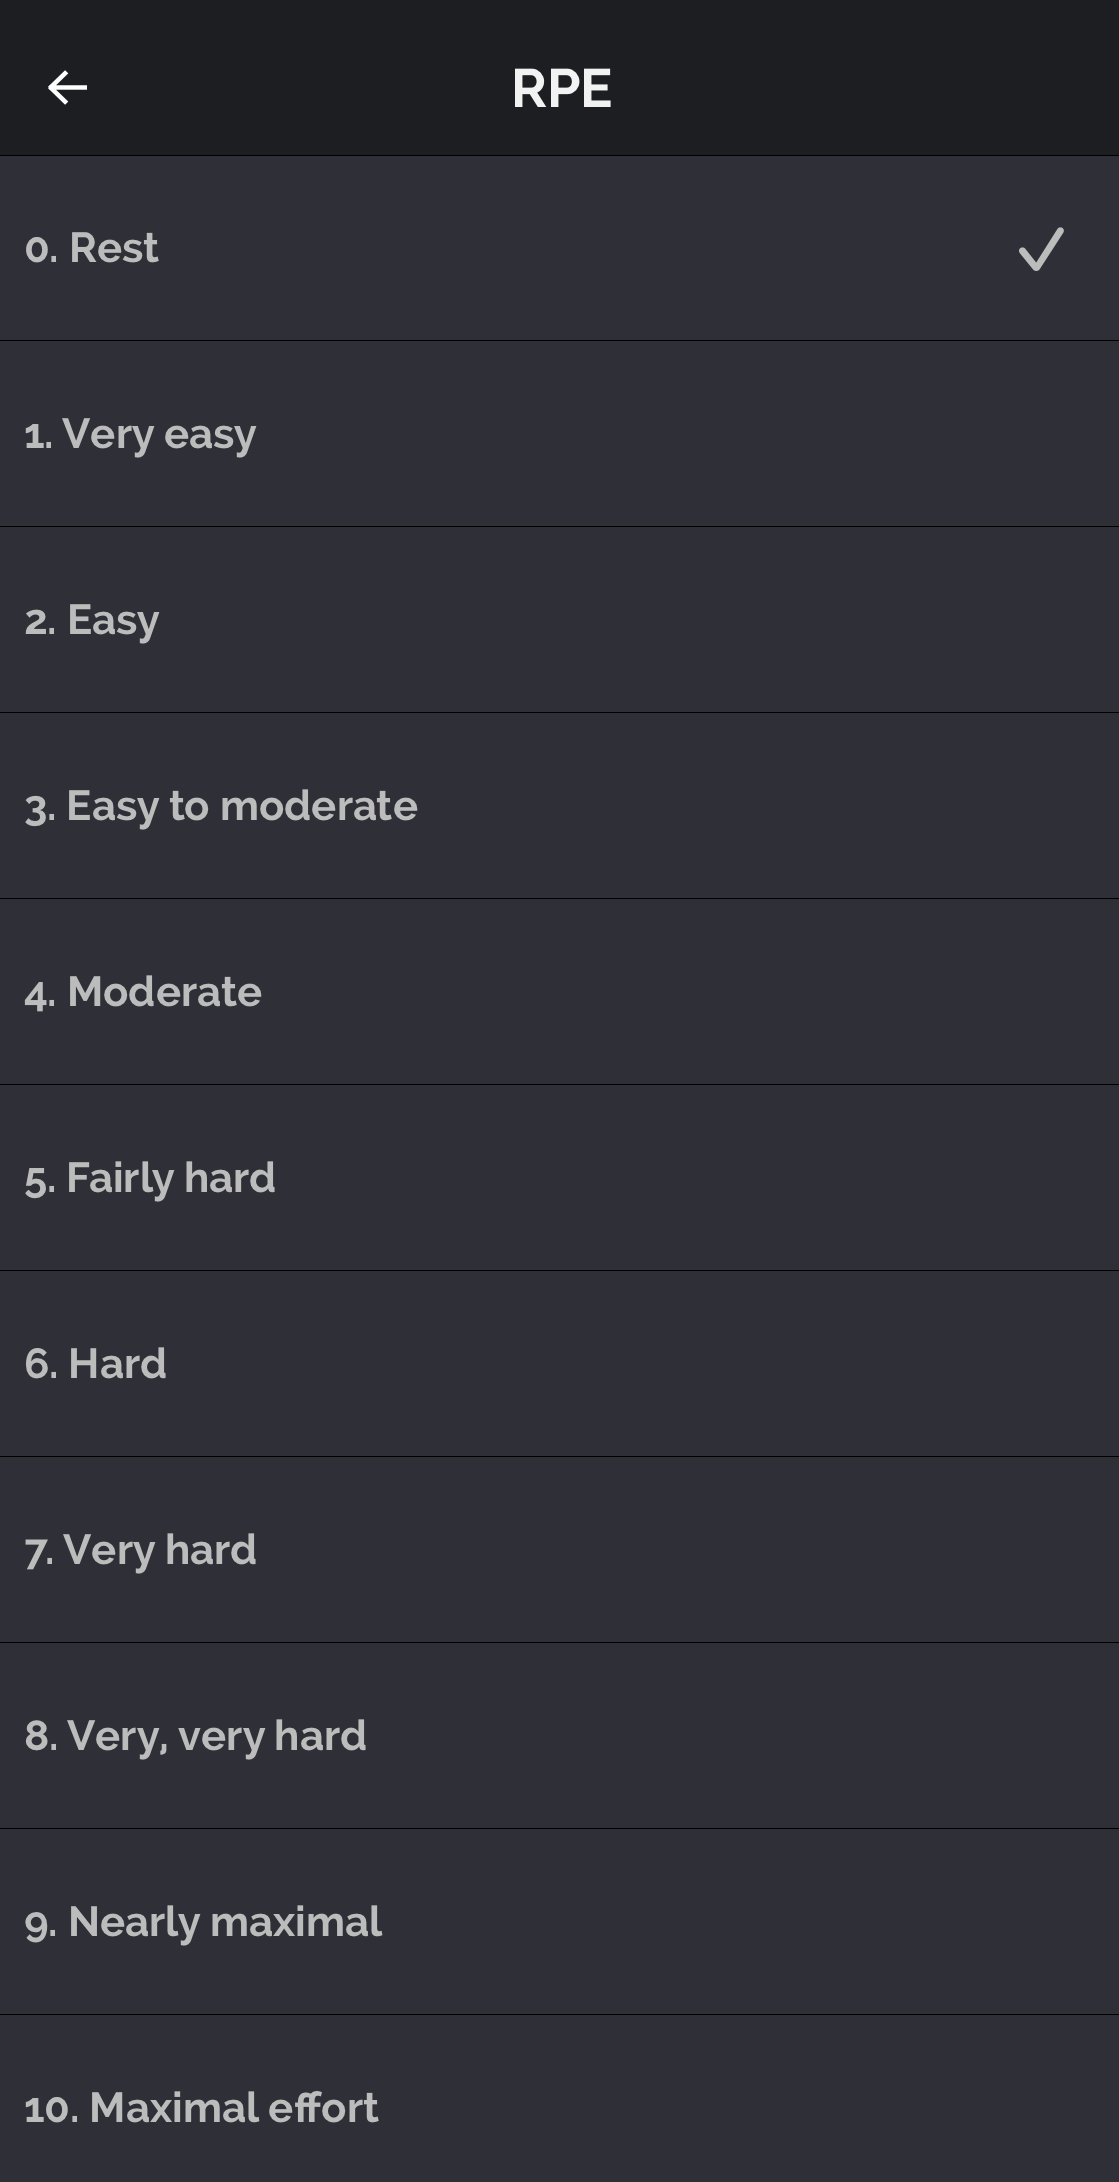
Soon after completing a training session, the athlete evaluates its intensity on a scale from 0 to 10 (a refinement from Borg’s original scale). The image below is from the Xhale app where athletes can fill out this data, but it can also be entered with the drop-down menu on the browser.
Using the RPE function encourages the athlete to reflect on how they felt during the session
How does it help the coach?
Using the RPE function encourages the athlete to reflect on how they felt during the session. Over a period of months this information compounds to produce valuable insights for the coach.
It gives the coach a visual aid to look at things like:
- Is training load over the last few weeks increasing or decreasing?
- Did they suddenly have a spike in training load in the last few days or weeks?
- Are they recovering well during a taper?
- Are they risking injury with higher than normal training load?
- Are there gaps in their programme where training load could be higher?
- How is recovery going after a big race / heavy training block?
- If an injury or illness does occur it is also a useful reflection tool.
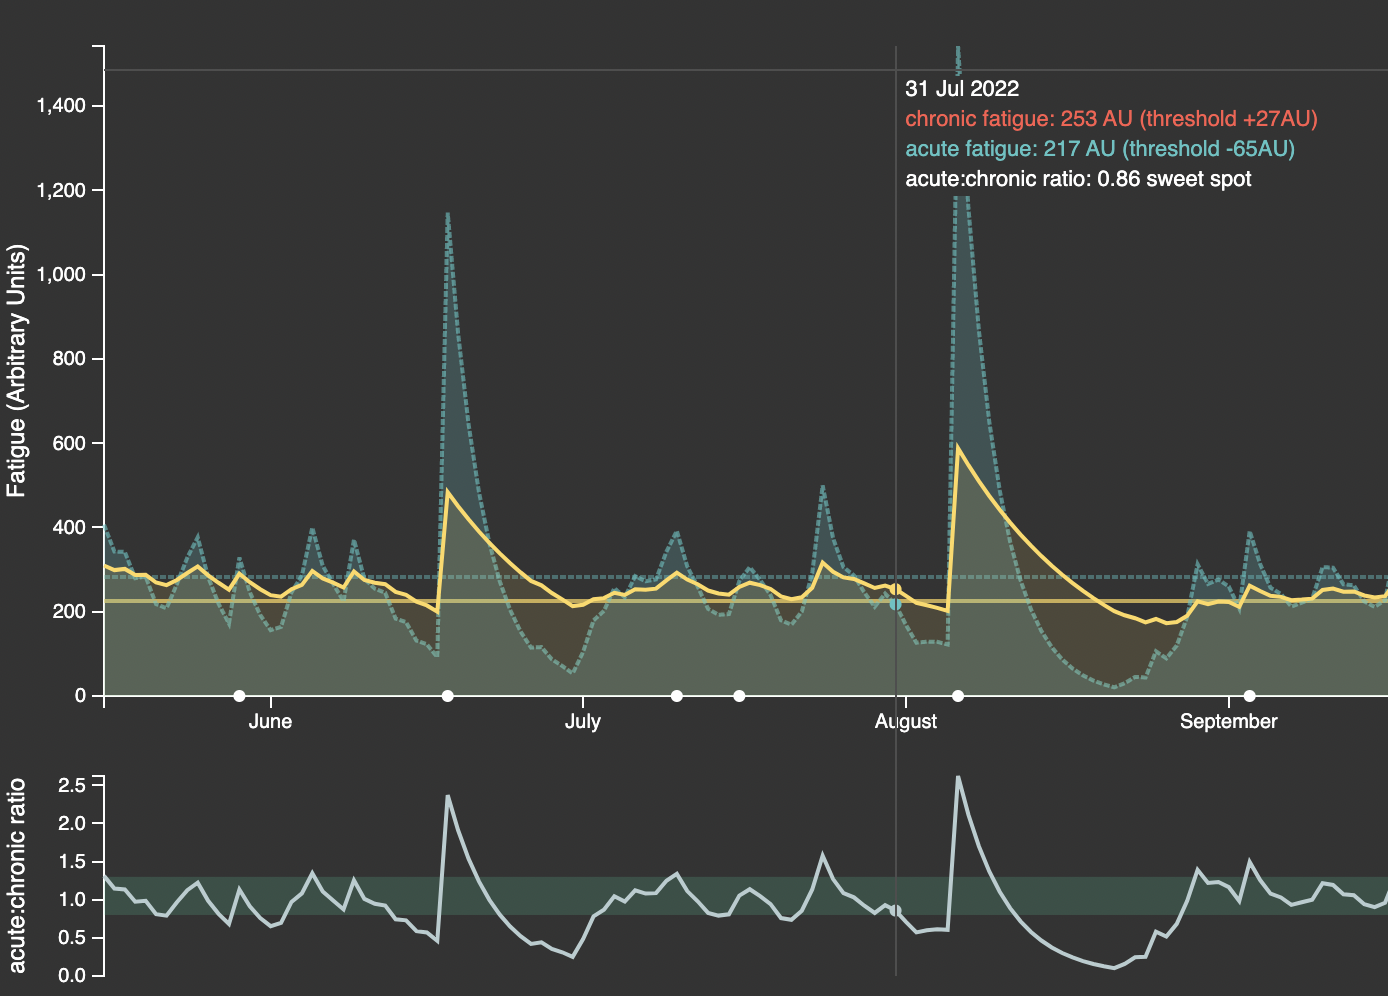
The example below shows an athlete tapering into a race in mid June. The aim in the taper is to bring the acute:chronic ratio down as the athlete recovers and gets ready to peak. The race produces a spike in fatigue (significantly acute) but as the athlete rests after the race we can see both chronic and acute fatigue levels dropping again into early July (look at the bottom ratio graph and note that in recovery phases athletes should not be in the green training ‘sweet-spot’).
The next training block in July, again brings the athlete into the sweet spot for development, but perhaps some underlying fatigue is evident in the spikes with hard training sessions. There is another race in August with a big spike in fatigue, and a longer recovery phase is needed after this second race which created more fatigue for the athlete.
Example of run fatigue and potential injury risk
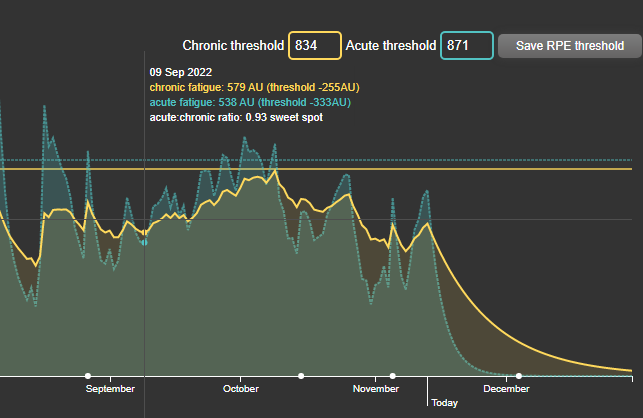
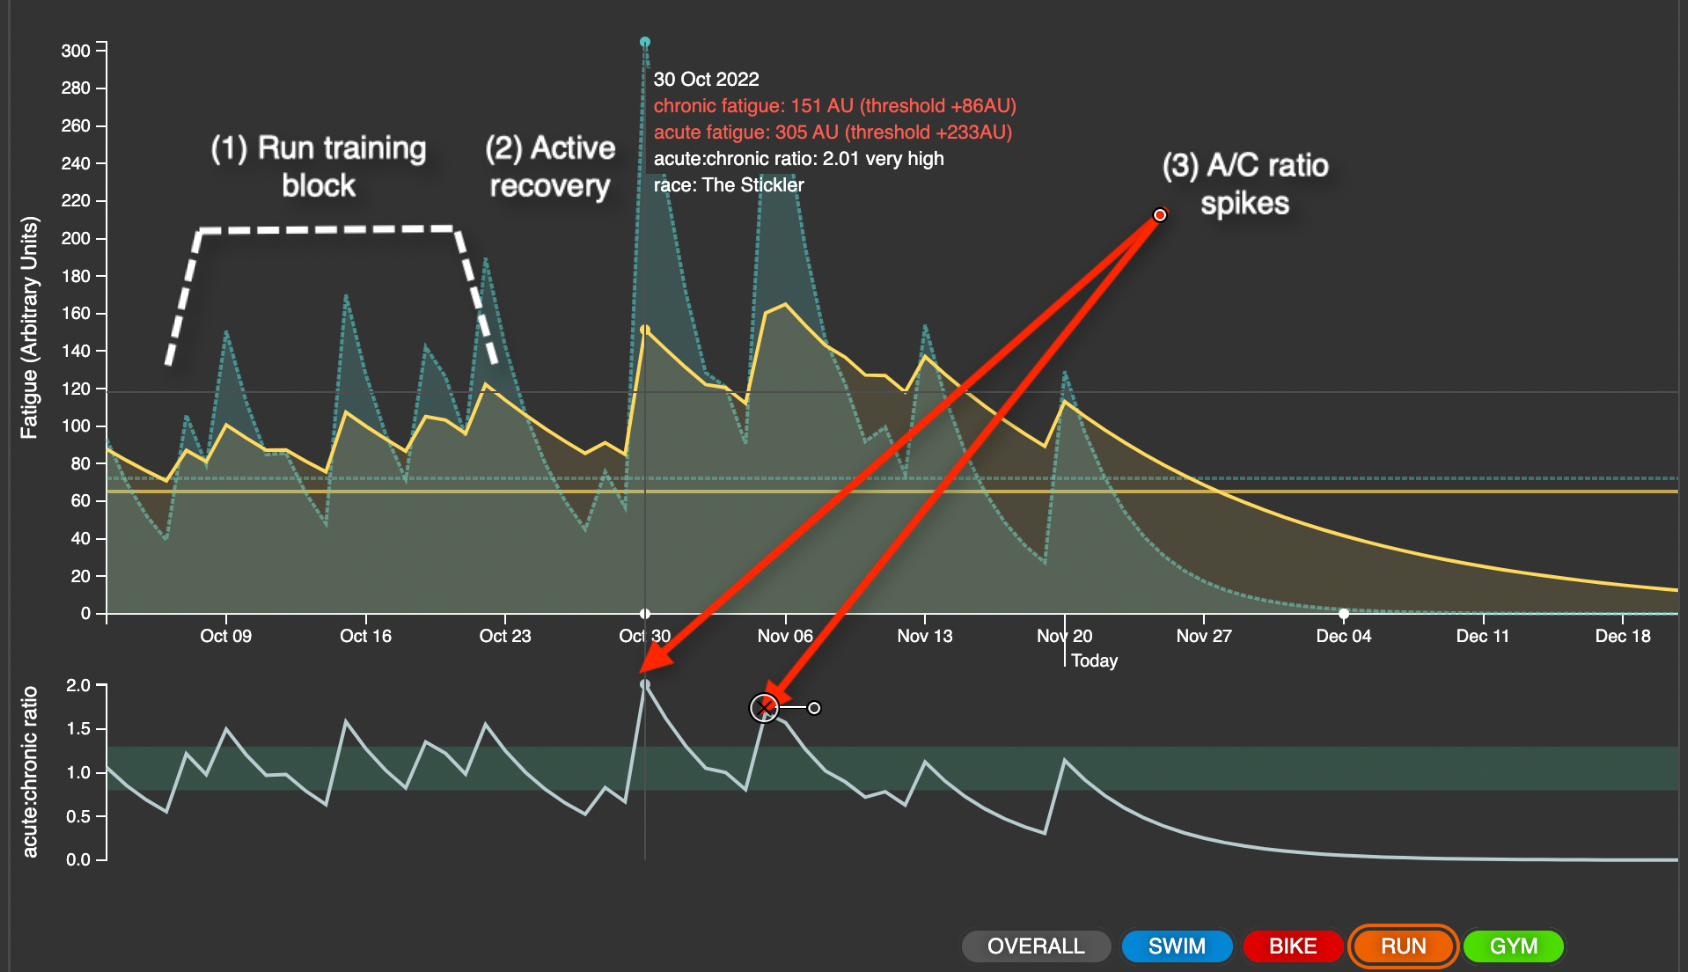
Here you can see that a block of run training has developed the athlete in the RPE sweet spot for a good three week period in October (1). But within that, the harder sessions are creating acute fatigue which pushes the ratio up to just over 1.5. The coach gives the athlete an active recovery week (2) but as the athlete returns to training the harder sessions are still creating spikes in the ratio (3) which could indicate a potential injury risk. At this point the coach can look back at this athletes history with RPE response, but also assess what else is going on in their lives to make a decision about programming future training. In this example the coach has decided to give the athlete a period of lower volume and intensity in November before returning to harder training.
How does the function work in Xhale?
Soon after each session, athlete’s record what they perceived the intensity of the session to be on the scale from 0-10. The software then uses this and the duration of the session to calculate a simple ‘training load’ for each session:
RPE rating x minutes-of-training = training load
Training loads for each session are then added up with some adjustment for the different impacts of swim vs bike vs run. This training load is used to estimate fatigue in the short and medium term:
- Chronic Fatigue = Training load over the last few weeks
- Acute Fatigue = Training load in the last few days
A session completed the previous day will obviously have more impact on fatigue than a session completed a week prior as the athlete recovers and gets fitter. To reflect the lower impact on fatigue from training completed longer ago, older values are given less weight in the fatigue scores.
We use a formula with an “exponentially weighted moving average” to show this drop in impact. For those who love the maths here is the formula:
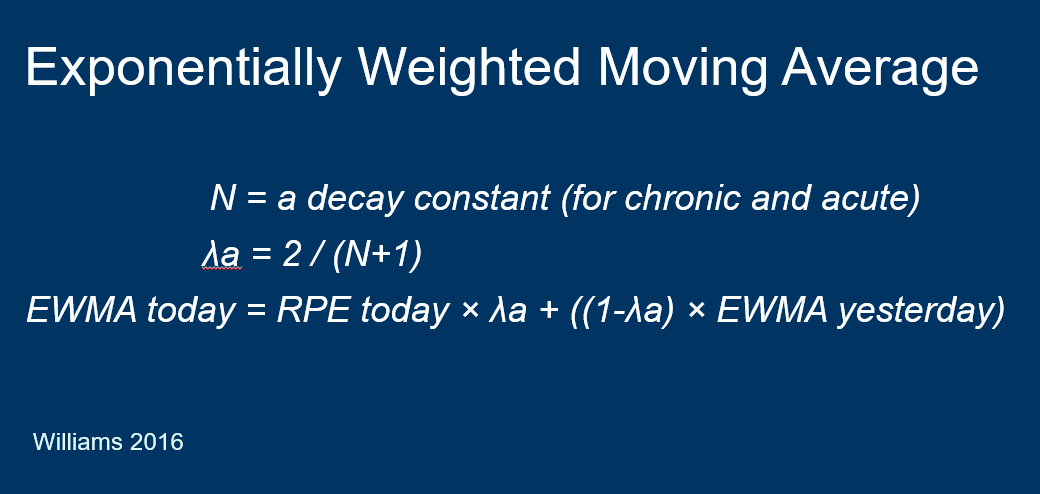
Where we use time delay constants N = 7 (ie. a week) for acute fatigue and N=28 (ie. 4 weeks) for chronic fatigue.
For each athlete the figures will be different. How someone rates a session on the RPE scale is personal to that athlete. The actual figures on the charts are therefore only an individual representation of how fatigued that athlete is and should not be compared between athletes. But trends and patterns in the data over time help the coach build an accurate and helpful guide to aid development and help with programming.
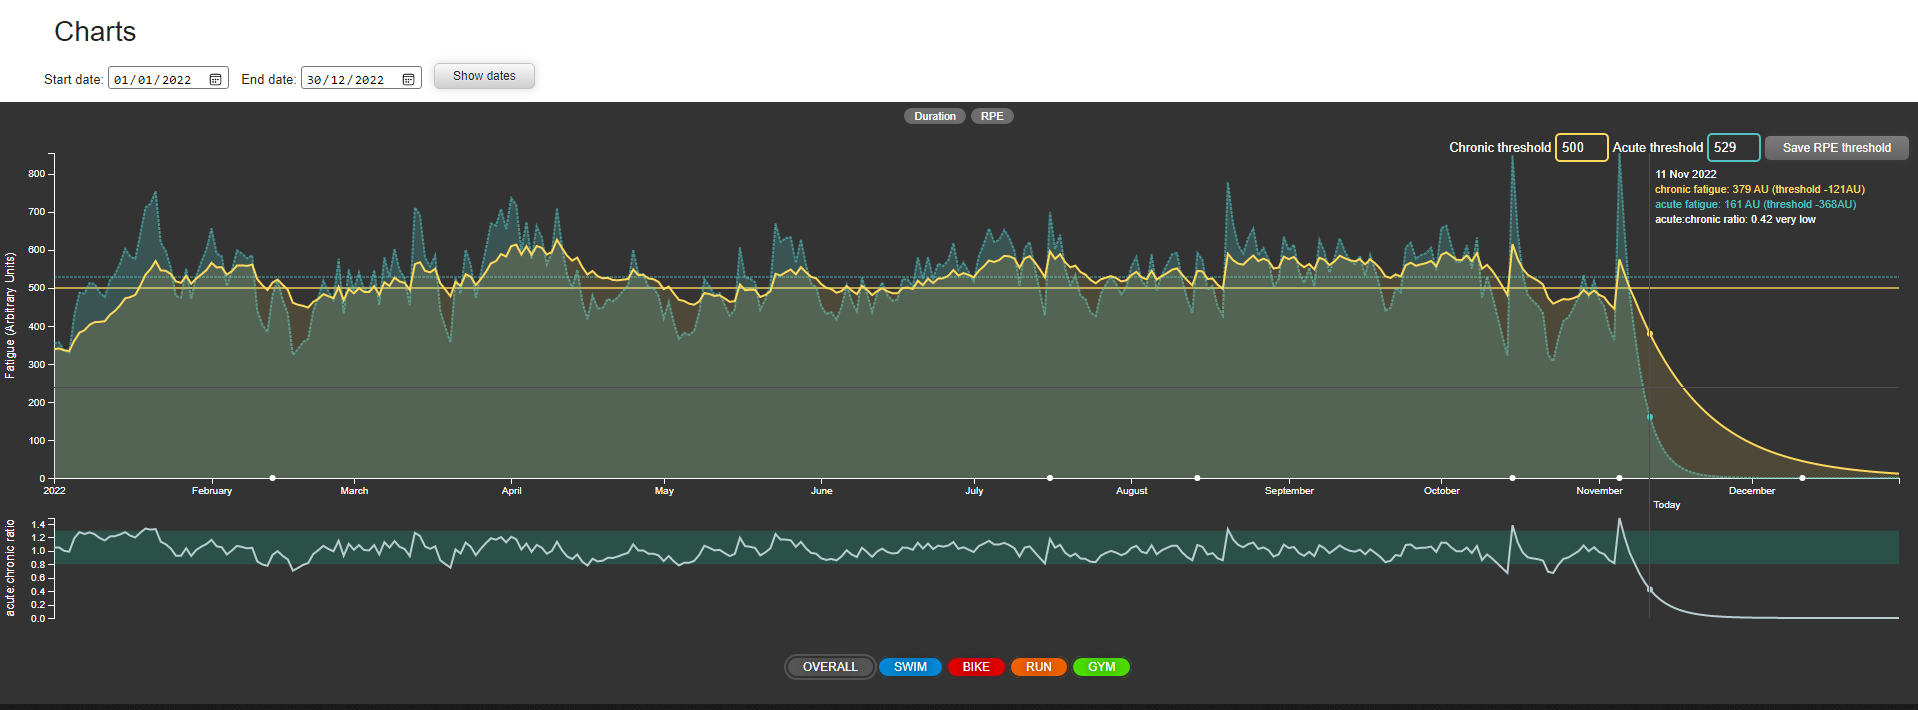
You can manually set chronic fatigue and acute fatigue thresholds on your chart view for a particular athlete. This is useful after you have gathered some months of data from that athlete. As a coach you can look back at the impact training had on your athlete from the feedback they have given you. You will learn what feels like too much cumulative fatigue to them, and where their individual thresholds are. Once these are set, if the training load an athlete is experiencing exceeds one of these limits, you will be notified in the notes section of that athlete’s diary in Xhale.
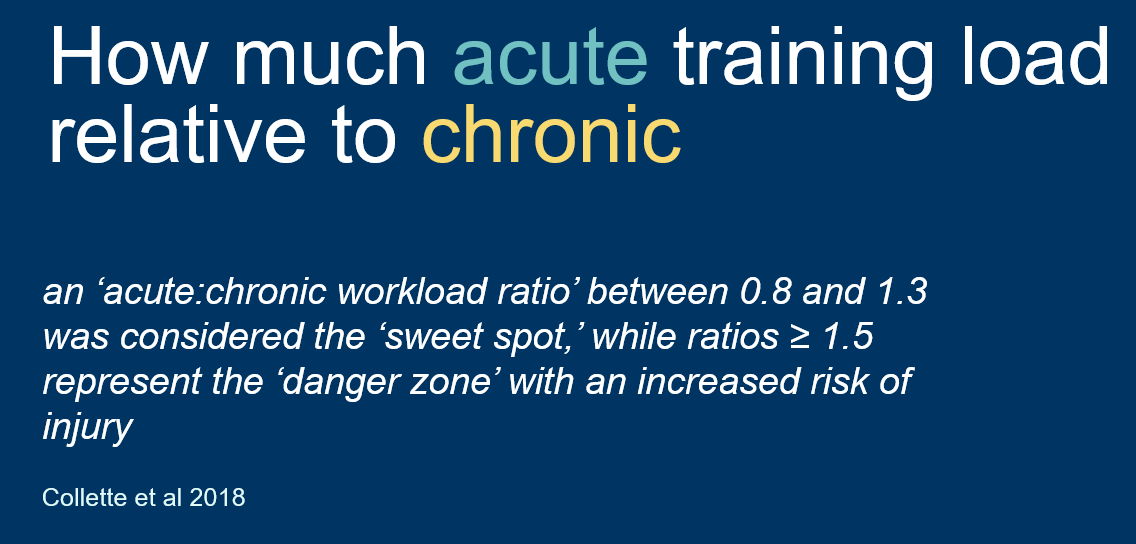
Xhale will automatically track the acute:chronic workload ratio beneath the main RPE chart as shown in the image below. Highlighted on this chart is a green area which represents what is considered to be the “sweet spot” for training development. Research shows that pushing above a ratio of 1.5 represents an increased risk of injury.
In Xhale you can also filter the RPE charts for each different sport. But it is critical to remember that fatigue from one sport will impact fatigue in another. If you have an athlete who is training in multiple sports, it is useful to view both the individual sport charts as well as the overall charts and especially the overall acute:chronic ratio.
Further Reading
If you want to learn more on this topic, here are some useful resources. If you find other resources that you would like to make our community of coaches aware of, please pass the details to us and we will include on future reading lists.
- Relation Between Training Load and Recovery-Stress State in High-Performance Swimming – Collette et al 2018
- Session-RPE Method for Training Load Monitoring: Validity, Ecological Usefulness, and Influencing Factors – Haddad et al 2017
- Factors That Influence the Rating of Perceived Exertion After Endurance Training – Roos et al 2018
- Differences in perceptions of training by coaches and athletes – Foster et al 2001
- Monitoring the training process in competitive road cyclists: a critical evaluation of intensity and load measures and their ability to inform the training process – Sanders 2018
- Better way to determine the acute:chronic workload ratio? – Williams 2016
RPE One-to-One Workshop
If you need some more information about how this function works and how to incorporate it into your coaching, then we are always available to do a screen share with you to discuss. Book a one-to-one workshop with co-founder and RPE function co-creator Mark Livesey to have a more in-depth discussion.
Email: mark@trainxhale.com
Got something to add?
If you would like to input to our Coaches’ Hub – or there is a topic you would like us to write about – why not send us your ideas? We are always looking for good content.
Email: caroline@trainxhale.com

